Data Activator: Low‑Latency Event Detection Fabric

Today I’m excited to discuss Data Activator, an important capability in Microsoft Fabric. Data Activator closes the gap between gathering data and driving decision-making. As data volumes grow rapidly, being able to both observe and respond to events in real time becomes essential. Data Activator addresses that need by combining observability, analysis, and automated response into a single service. This means not only can it track and monitor data, but it can also interpret it and trigger predefined actions based on specific patterns or conditions detected.
What is data activator? is a no-code, low-latency event detection engine that operates as part of Microsoft Fabric's Real-Time Intelligence stack. To understand Data Activator, you need to understand stream processing fundamentals. Unlike batch processing, which operates on finite datasets collected over time, stream processing handles unbounded data streams, continuous flows of events with no predetermined end. Read my previous article for a broader understanding.
Stateful vs. Stateless Stream Processing
Stateless processing evaluates each event independently. If you're checking whether a package temperature exceeds 45°F, each sensor reading is examined in isolation. The system has no memory of previous readings.
Stateful processing maintains context across events. The "state" can take many forms: aggregations (counts, sums, averages calculated over time windows), joins (information temporarily stored to correlate with matching data from other streams), or pattern detection (tracking sequences of events that meet specific criteria).
Data Activator implements stateful processing through several mechanisms:
State tracking per object: Each monitored entity (device, package, customer) maintains its own state, enabling independent evaluation
Temporal windowing: Aggregating and evaluating data across sliding or tumbling time windows
Delta detection: Tracking changes between consecutive event values to identify trends
State transition logic: Firing actions only when conditions change, not when they remain constant
Complex Event Processing (CEP) Integration
CEP is a subset of stream processing, a set of techniques for processing real-time events and extracting meaningful information from event streams on a continuous basis. Data Activator implements CEP patterns to detect:
Threshold violations: Simple scalar comparisons (temperature > 45°F)
Trend detection: Identifying increases, decreases, or rate-of-change patterns
Sequence patterns: Recognizing specific event ordering (A followed by B within time window C)
Absence patterns: Detecting when expected events fail to arrive (heartbeat monitoring)
Complex correlations: Joining multiple event streams to identify compound conditions
The distinction is important: while basic stream processing handles data transformation and routing, CEP focuses on pattern matching and correlation across event streams to identify higher-order, business-meaningful events.
Architectural component
Let me break down the technical architecture using proper terminology.
Architecturally, it acts as an intelligent observer, consuming high-velocity data streams, evaluating rule conditions in near real-time, and initiating automated downstream actions based on changes in event states.
It fits into a reactive, event-driven architecture where data flows continuously, and decisions are made based on stateful evaluations of event data in near real-time.
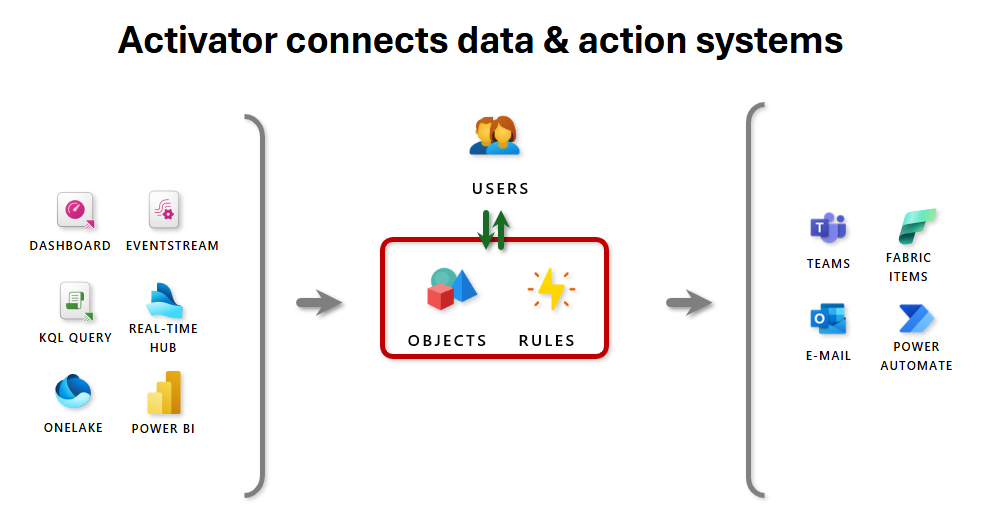
Event sources
Activator subscribes directly to event streams that ingest telemetry and messages from upstream producers such as Azure Event Hubs, IoT devices, custom HTTP endpoints, and other streaming ingestion endpoints. Those streams are the primary ingestion layer; an activator can attach to one or multiple streams to consume new events as they arrive. In addition to raw streams, activators can also consume Fabric or Azure platform events, or listen to changes emitted by Power BI reports and Real‑Time dashboards.
Events and objects
An event is a single record delivered by n event stream — for example, a telemetry sample, a log line, or a file‑arrival notification. Activator groups related events into objects using a shared entity key (for example
device_idorasset_id). Rules are evaluated at the object level so detections are scoped per entity, enabling per‑sensor or per‑asset monitoring rather than global, noisy matches.Rules and conditions
Each activator contains one or more continuously evaluated rules. Rules can be simple predicates (for example
value < threshold) or stateful expressions that track transitions over time, such asBECOMES,INCREASES,DECREASES,EXIT RANGE, or absence/heartbeat checks. The engine maintains per‑object state so it can detect patterns, enforce persistence (N consecutive matches), and evaluate temporal conditions across windows or ordered events.Actions
When a rule condition is satisfied, Activator can trigger:
pipelines, notebooks, functions, or spark job definition in Fabric.
External actions via Power Automate.
Send Teams message to an individual, group, or channel
Send e-mail
Alert and rule testing
Before enabling a rule, Activator offers preview and impact estimation so you can see how often the rule would have fired against historical data. These preflight checks help tune thresholds and avoid alert storms. The runtime also manages state transitions and suppression logic (for example requiring a threshold crossing rather than continuous below‑threshold values) to reduce noise and prevent repeated firing on the same condition.
Monitoring and cost control
Activator instances run within Fabric capacity units and incur cost only while active. You monitor activator health and usage from the workspace: evaluation metrics, match counts, action success/failure rates, and throttling events are surfaced in runtime logs and telemetry. Event streams and pipeline outputs provide additional observability for debugging and post‑mortem analysis, and throttling controls let you limit action throughput to protect downstream systems.
Data Source Integration
Data Activator connects to multiple source types, each with different integration patterns.
Eventstreams
Direct subscription to Eventstream items provides the lowest-latency path. The system receives events as they're published, without polling overhead.
Schema evolution handling: When event schemas change, Data Activator can handle both backward and forward compatibility:
Adding optional fields: New properties ignored by existing rules
Removing fields: Rules referencing missing properties handle gracefully
Type changes: Explicit migration or versioning strategies required
Power BI Integration
Integration with Power BI occurs at the semantic layer. When you create an alert from a Power BI visual:
The visual's underlying DAX query is captured
Data Activator creates a bridge that periodically executes the query
Results are converted into event streams
Standard rule evaluation applies to these derived events
This pattern is higher latency than direct Eventstream connection (typically minutes rather than subseconds) but enables business users to monitor aggregated metrics without understanding underlying data structures.
Real-Time Dashboards
Similar to Power BI integration but optimized for lower latency. Real-Time Dashboards in Fabric connect directly to Kusto Data Explorer (KQL) queries, providing near-real-time refresh rates.
Azure Events
Data Activator can monitor control plane events:
Blob storage changes (file created, modified, deleted)
Pipeline execution state changes (started, succeeded, failed)
Capacity throttling events
Authentication and authorization events
These events enable infrastructure monitoring and orchestration workflows—like automatically triggering data refresh when source files arrive, or alerting when pipelines fail.
Common use cases
Here are a few real-world scenarios where you can use Fabric Activator:
Automatically launch ad campaigns when same-store sales decline, helping to boost performance in underperforming locations.
Notify grocery store managers to relocate food from malfunctioning freezers before spoilage occurs.
Trigger personalized outreach workflows when a customer’s journey across apps, websites, or other touchpoints indicates a negative experience.
Proactively initiate investigation workflows when a shipment’s status wasn't updated within a defined timeframe, helping to locate lost packages faster.
Alert account teams when customers fall into arrears, using customized thresholds for time or outstanding balances per customer.
Monitor pipeline health and automatically rerun failed jobs or alert teams when anomalies or failures are detected.
In conclusion, your data delivers value only when it drives timely action. Fabric Activator bridges the gap between insight and execution by removing the need for constant manual monitoring and complex coding. Instead of repeatedly checking reports and dashboards, teams can rely on automated, no-code rules that watch both historical and real-time data across Fabric and respond the moment conditions are met. Whether it’s flagging overdue payments, monitoring inventory levels, ensuring data quality, or reacting to IoT signals, Activator empowers business users to act faster and smarter. With alerts delivered directly through Microsoft Teams, the right people are notified at the right time, enabling organizations to turn data into decisive action with ease.
Next article? Create and activate a Fabric activator rule

