Medallion Architecture in Microsoft Fabric

In this article, we're going to demo a medallion architecture within a Fabric Lakehouse using notebooks. But before we jump into the code, I want to make sure you understand exactly what medallion architecture is, why it matters, and when to use it. Then we'll ,learn how to implement, step by step.
By the end of this blog, you'll have:
A solid understanding of what medallion architecture is and why organizations use it
Hands-on code you can run in your own Fabric workspace
Best practices
Troubleshooting tips for common issues
What is the medallion lakehouse architecture?
The medallion architecture describes a series of data layers that denote the quality of data stored in the lakehouse.
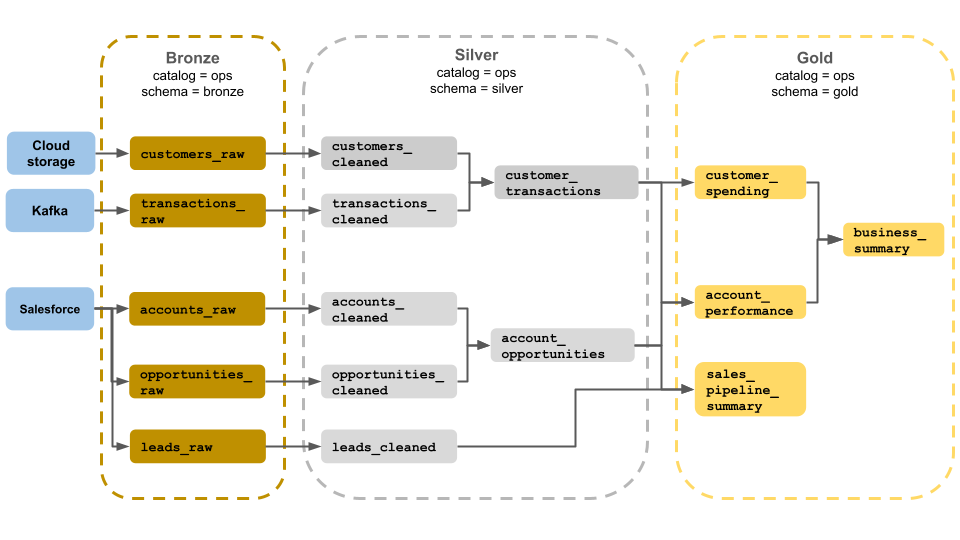
This architecture guarantees atomicity, consistency, isolation, and durability as data passes through multiple layers of validations and transformations before being stored in a layout optimized for efficient analytics. The terms bronze (raw), silver (validated), and gold (enriched) describe the quality of the data in each of these layers.
Medallion architecture as a data design pattern
A medallion architecture is a data design pattern used to organize data logically. Its goal is to incrementally and progressively improve the structure and quality of data as it flows through each layer of the architecture (from Bronze ⇒ Silver ⇒ Gold layer tables). By progressing data through these layers, organizations can incrementally improve data quality and reliability, making it more suitable for business intelligence and machine learning applications.
Does it sound technical? let’s break it down: See yourself living in a messy room. You wouldn't just throw everything into one trash can, right? You'd probably sort things into categories; maybe "things to throw away," "things to clean," and "things ready to use.
We will define each layer alongside side their use cases:
The Bronze layer stores all the raw data from external source systems. For example: your company receives daily sales data from 50 retail stores. Some stores send CSV files, others send JSON from APIs, and a few still email Excel spreadsheets. The Bronze layer stores ALL of this exactly as received, CSV stays CSV, JSON stays JSON, Excel stays Excel. No changes.
This layer acts as your historical backup, which means that if you ever notice an error or bug while cleaning or transforming your data in the silver layer, you can always go back to Bronze and start fresh without contacting the source systems again.
In the Silver layer of the lakehouse, the data from the Bronze layer is matched, merged, and cleansed so that the Silver layer can provide an "Enterprise view" of all its key business entities, concepts and transactions.
Example: Those 50 retail store files from Bronze? Silver layer:
Converts all dates to the same format (some stores used MM/DD/YYYY, others DD/MM/YYYY)
Removes test transactions (employee purchases with $0 price)
Deduplicates orders that were sent twice
Validates that product IDs actually exist in your product fact table
Creates a unified "sales_silver" Delta table
Gold Layer is for reporting and uses more de-normalized and read-optimized data models with fewer joins. The final layer of data transformations and data quality rules are applied here. Final presentation layer of projects such as Customer Analytics, Product Quality Analytics, Inventory Analytics, Customer Segmentation, Product Recommendations, Marking/Sales Analytics etc. fit in this layer.
Transformations:
Aggregate data (daily sales by store, monthly revenue by region)
Create dimensional models (star schemas with fact and dimension tables)
Apply business logic (calculate profit margins, identify VIP customers)
Optimize for fast queries (denormalize tables, pre-calculate metrics)
From that Silver sales data, Gold layer creates:
FactSales table (one row per transaction with metrics)
DimCustomer table (customer attributes)
DimProduct table (product details)
DimDate table (calendar dimensions)
Sales_Summary view (pre-aggregated monthly totals)
Now let's get practical. I'm going to show you exactly how to build this, step by step.
On your browser type https://app.fabric.microsoft.com and sign in with your Fabric account. If you don't have access yet, you can start a free 60-day trial. No credit card required.
Click Workspaces (🗇) in the left navigation panel → Select + new workspace → Give it (any name of your choice). For this demo, for this demo, I'm using "fabricseries" as my workspace
Go to the Workspace settings → find Data model editing and toggle it on. (Note: This feature is already activated in my environment, but you may need to enable it manually)
In your workspace, click + New → Select Lakehouse from the list → Give it any name of your choice (I'm using "Sales_Medallion_Demo") lakehouse → Click create → Your lakehouse will open automatically once it's created.
Upload sample data folder
For this demo, we need some data to work with:
In your lakehouse, navigate to the Files section
Click Upload → Upload folder
Select the orders folder containing your sample data
Wait for the upload to complete
Your data is now in the lakehouse and ready to be processed through the medallion layers.

After ingesting data into the Bronze layer, run the notebook transformations to standardize and validate records, then write the output to a Delta table in the Silver layer for downstream consumption.
Let’s explore our SQL Analytics endpoint to answer a few questions such as revenue for each year in the order_silver table

and top5 customers in terms of quantity.

Gold Layer
We've moved data from bronze to silver. Now we'll use a new notebook to further transform the data, create a star schema, and load it into gold_Delta tables.

This code creates a date table by taking all unique dates from your orders and breaking them down into useful parts. It extracts the day, month, and year as separate numbers, making it easier to filter and group your data later. It also creates two different date formats: one that's easy to read (like "Jul-2019") and one for sorting (like "2019-07"). The dates are arranged in order from earliest to latest. This date table will connect to your sales data, allowing you to analyze sales by day, month, or year without having to calculate these values every time you create a report.
MedalIion Architecture in my lakehouse
The screenshot below shows the structure of my Fabric lakehouse (fabseries_lake) across the Medallion Architecture layers.

At the bottom, inside Files, you can see bronze_orders, this is the Bronze layer, where the raw source data is ingested. No transformations, no cleaning, just the original files stored in their native format. Bronze acts as our immutable data foundation for reprocessing, auditing, and lineage.
Moving up to Tables, you’ll find:
- order_silver → This is the Silver layer table.
At this stage, the raw Bronze data has been transformed in a notebook, deduplicated, and standardized. Silver is where we enforce schema consistency, fix data quality issues, and prepare the dataset for modeling. It’s stored as a Delta table to support ACID transactions.
Above that, you’ll see the fully curated Gold layer tables:
dimcustomer_gold
dimdate_gold
dimproduct_gold
factororder_gold
These represent the semantic layer of the lakehouse, conforming dimensions and fact tables modeled in a star-schema style. At Gold, the data is aggregated, business-ready, and optimized for reporting performance. This is the layer that Power BI connects to through the SQL analytics endpoint.
Using Delta Lake's merge functionality, we perform an upsert operation on fact_sales_gold, matching on the composite key of OrderDate, CustomerID, and ItemID. This ensures incremental loading of sales transactions while maintaining data integrity. The gold layer star schema is now production-ready for analytical workloads
In summary: Bronze → raw ingestion
Silver → cleaned & transformed Delta tables
Gold → dimensional and fact models optimized for analytics
Create a semantic model
From the Orders lakehouse interface, select the semantic model creation option and instantiate a new model named orders_gold_layer

Select Confirm to include the following tables in the semantic model:
dimcustomer_gold
dimdate_gold
dimproduct_gold
factsales_gold

Next is to define table relationships and create DAX measures. Your data team can now create reports and dashboards that query the gold layer directly, automatically reflecting the latest data.

Enjoyed this article? Drop a comment and share it with your dev/data friends. Want to learn more? Check out Microsoft documentation:
Read other articles on Medium


